In the AdventureWorks Power BI project, I applied data preparation, modeling, and visualization techniques to simulate real-world tasks. Using Power Query, I connected to data sources, transformed data, and built a relational data model. I utilized DAX to create calculated fields and performed advanced data analysis, including time-based calculations. Interactive reports and dashboards were designed to visualize key metrics, trends, and business insights. This project demonstrates my ability to work with Power BI, Power Query, and DAX to create actionable insights from data.


The Data Professional Survey Dashboard provides insights into key factors affecting data professionals, including happiness linked to salary and work-life balance, geographic distribution, and industry representation. Visualizations include a treemap showing most respondents are from the U.S., a stacked bar chart highlighting Data Scientists as the highest earners (averaging nearly $100k), and a donut chart breaking down industry representation. Programming language preferences are showcased in a stacked column chart, while a gauge chart measures happiness levels. Post data cleaning, the analysis focuses on 274 professionals, summarizing metrics like respondent count and averages in card labels.

This project contains a detailed pizza sales dashboard designed to track and visualize key sales metrics. The dashboard provides insights into various performance indicators, such as total revenue, average order value, the total number of pizzas sold, and more. It also offers a view of the top and bottom-selling pizzas, peak sales periods, and performance metrics based on pizza categories and sizes.

This project focused on analyzing layoffs data through SQL, emphasizing data cleaning and preprocessing to ensure accuracy. Key insights included identifying industry-specific layoff trends, geographic distribution of affected employees, and peak periods of layoffs. By conducting exploratory data analysis, the project highlighted workforce dynamics and provided a clear understanding of how layoffs impacted various sectors and locations.

This project involved creating a comprehensive HR dashboard in Tableau, designed to help HR managers analyze and visualize workforce data. The dashboard includes high-level summary views focusing on key HR metrics such as total employee counts (hired, active, and terminated), trends in hiring and terminations, department breakdowns, and geographic distribution of employees. The demographics section highlights gender distribution, age groups, education levels, and the relationship between education and performance ratings. The income analysis explores salary trends across different education levels, gender, and age groups. Additionally, the detailed employee records section provides a comprehensive list of employees with filter options for sorting and exploring data based on attributes like department, position, and salary.

This project focuses on analyzing Airbnb listings to uncover trends in pricing, occupancy, and geographic distribution. The dashboard provides insights into factors that influence pricing, such as room type, location, and reviews, enabling property owners and potential guests to make informed decisions. By visualizing this data, the project aims to optimize rental strategies and improve understanding of market dynamics. This analysis is crucial for identifying high-demand areas, setting competitive prices, and enhancing the overall guest experience.

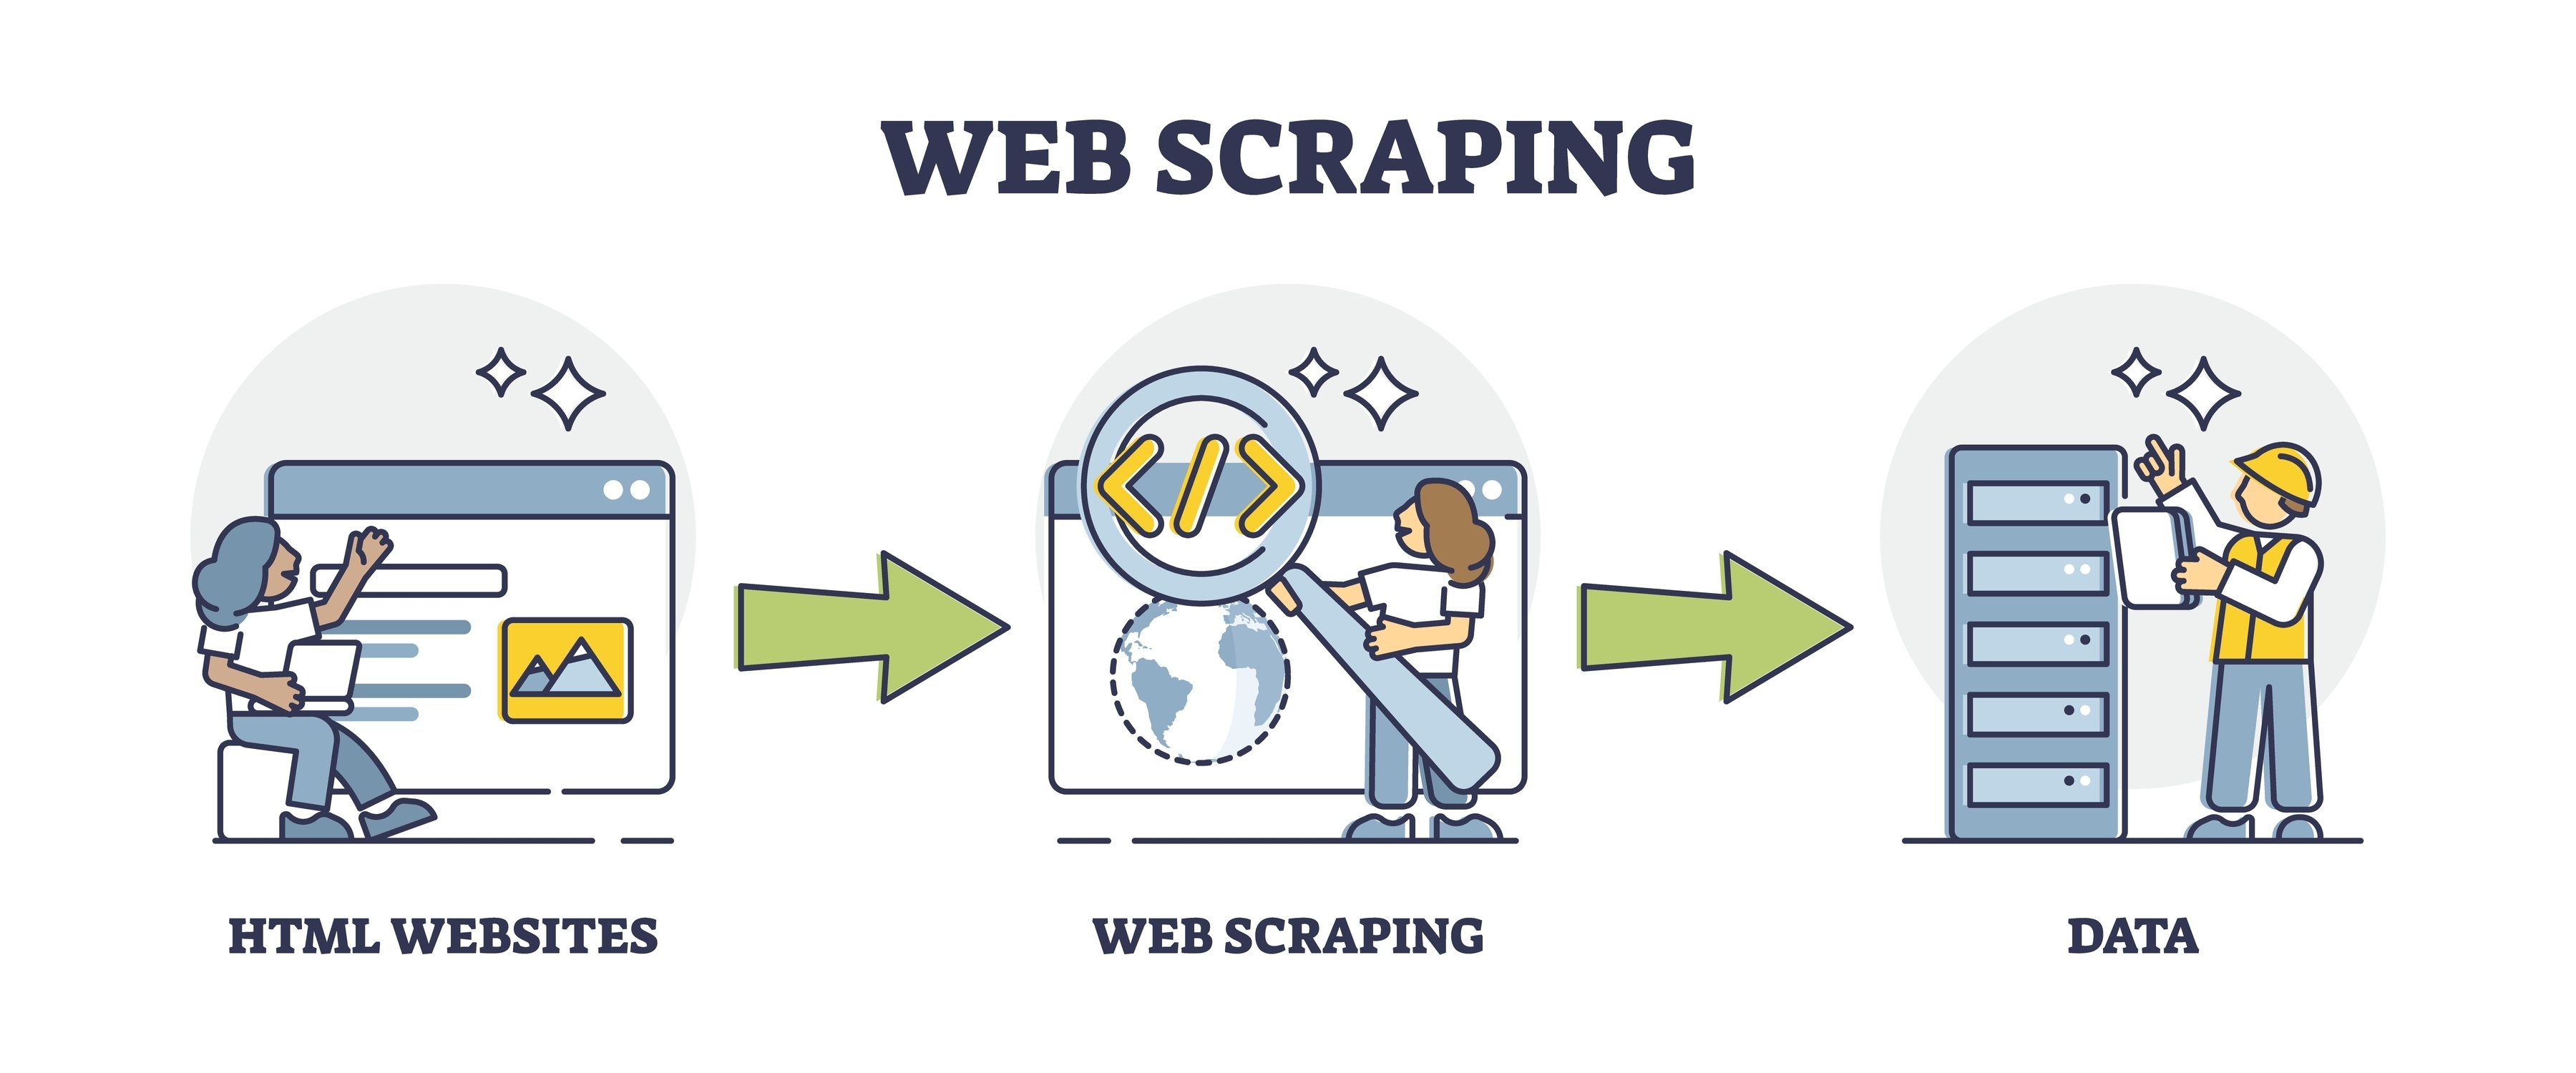
In this project, I created a dataset by scraping data from a webpage over a period of six years, from January 1st, 2018, to December 31st, 2023. The dataset included daily data points such as date, price, likes, dislikes, and followers, which were extracted by parsing the website with a dynamically changing URL. After gathering the data, I cleaned and preprocessed it to ensure accuracy, then saved it as a CSV file for further analysis. I applied regression techniques to predict the price of the product on January 1st, 2024, selecting the algorithm with the lowest RMSE to ensure the most accurate forecast. This project combined web scraping, data cleaning, and machine learning to deliver a predictive model based on historical data.

In this project, I conducted exploratory data analysis (EDA) on an Airbnb dataset using Python to uncover insights into factors affecting pricing, occupancy rates, and guest preferences. The analysis included examining the relationships between variables such as room type, location, number of reviews, and price. Visualizations and statistical analysis were used to identify trends and patterns, helping to understand the factors that drive demand and influence rental prices. This project provided valuable insights for optimizing pricing strategies and improving the overall Airbnb experience for both hosts and guests.

This project involved developing an Excel dashboard to analyze and visualize road accident data. The dashboard provided insights into key metrics such as accident frequency, locations, causes, and severity over time. Using Excel’s pivot tables, charts, and data filters, the dashboard allowed users to explore accident trends by factors like time of day, weather conditions, and accident types. This project demonstrated the ability to leverage Excel for creating an interactive and insightful tool to better understand road safety issues and inform decision-making.

This project involved creating an interactive dashboard in Excel to visualize and analyze bike sales data. The dashboard provided insights into key sales metrics such as total sales, sales by region, top-performing products, and trends over time. Using Excel's built-in features like pivot tables, charts, and slicers, the dashboard allowed users to explore data in a dynamic way, enabling better decision-making and identifying sales patterns. This project highlighted the power of Excel for creating intuitive, data-driven dashboards to track business performance.

In these projects, I applied a range of machine learning techniques to solve real-world problems. I worked on tasks such as association rule mining, bankruptcy prediction, and clustering, utilizing algorithms like linear regression, logistic regression, random forest, and SVM. Additionally, I explored Monte Carlo simulations for risk analysis, NLP for text processing, and wine fraud prediction using classification algorithms. These projects helped me gain hands-on experience in feature engineering, model evaluation, and solving complex business problems using advanced AI and machine learning methods.


